We are glad to welcome you to another great content from MoneyBankLe.Com. In this post, we will talk about What is technical analysis in stock market and How to do it?. I really hope you are thrilled. If you liked this creation, please share it with your friends. Let’s start….. What is technical analysis in stock market and How to do it?
In a volatile equity market, every investor wants to use the best method for analyzing stocks. Technical analysis is commonly used in the stock market. It is used to know the trend. This is an analysis of short term menu recognition.
Technical analysis of a stock is the study of historical data of a stock including volume and price. The objective of technical analysis would be to use the past behavior of a stock to predict future movements.

It is very important to do research to get better returns in the stock market. For this, there should be knowledge of share market analysis. In this post, we have talked about technical analysis and how an investor does the right technical analysis of a stock.
Let’s start…..
What is Technical Analysis in Stock Market?
Technical analysis of a stock is a method of analyzing a stock using publicly available historical chart patterns of the stock. This method of analysis is primarily associated with equities, but can be used for a few different types of securities as well.
In other words, technical analysis means understanding the past trends of charts and volumes and using other technical indicators to predict the behavior of a stock price and its future movements. It is generally used by short term traders who want to make quick money by observing patterns in stock prices. (What is technical analysis in stock market and How to do it?)
They are not concerned with the condition of the company nor are they interested in knowing the fundamentals of the company before investing in the company. Technical analysis developed from the principles of Charles Henry Dow, who is known as the father of technical analysis.
How is technical analysis different from fundamental analysis?
Fundamental analysis focuses on the financial, management and economic policies of the company etc. With the change in the numbers of the company’s financial position, the value of the stock changes in the future. This is the common method used by stock participants to analyze stocks.
On the other hand, technical analysis focuses on past price chart patterns and predicts the future price of a stock.
Both fundamental and technical analysis are used to forecast the future price of a stock but different data are used for analysis.
Technical Analysis – The Basics
May I inform you that the share price already reflects all the known and unknown information in the public domain
According to this theory, all the factors affecting the stock are already included in the current stock price. Hence, it is safe to assume that the current share price is quite reasonable. It is neither flimsy nor overpriced.
It is possible to trace the price movement:
The underlying assumption means that the price movement of any stock can be predicted. Although there are some random movements, however, the stock market is also full of recognizable trends.
If detected at the right time, the trader can make huge profits. The whole theory of technical analysis revolves around ‘trends’.
History repeats itself back:
It is fairly clear after reading the first two notions that technical analysts believe that people react to price movements in a remarkable manner. For example: In bull markets, traders want to earn as much as possible and thus, continue to buy despite high prices.
Similarly, in bear markets, people have negative emotions and focus on selling, even when prices are significantly lower at that time.
Now, let us discuss the ways in which the movement of prices is monitored on a daily basis to understand the trends. There are four types of prices recorded during the day:
Open : When the market opens in the morning, it is the first price to be executed during trading.
High: This is the highest price at which the trade is executed during the trading day.
Low : This is the lowest price at which a trade is executed during the trading day.
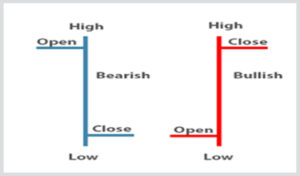
Closing Price : This is the last price at which the market closes. This is an important indicator that shows whether the market was bearish or bullish today. If the open price is lower than the closing price, then the market is considered to be up and if the closing price is lower than the open price, then the market is considered to be bearish.
How to do technical analysis of stocks?
The following are seven important steps in technical analysis to understand the Dow principles of technical analysis. These principles are propounded by Charles Henry Dow, founder and co-founder of The Wall Street Journal and Dow Jones & Company, respectively. Dow’s three investment principles are a good guide for technical analysts.
The following are the principles that explain how technical analysts use them:
The stock market reflects all known information.
- According to the first principle; The stock market reflects all known information. Known information refers to all information that is publicly available through any means. Technical analysts do not take any financial information for analysis.
- They do not associate themselves with the price-to-earnings ratio (P/E), return on equity ratio, shareholder equity or any other ratios like fundamental analysts.
The price trend can be found by :
- According to this principle, the price movement of a stock can be identified and charted. Everyone knows that prices go up and down and there is no fixed pattern. But according to theory, this does not always happen, price movements sometimes repeat themselves or move in a known trend.
- Once you understand the trend, making money becomes quite easy. You can go with the strategy of buying low and selling high. Also, you can create a good position for futures trading.
History repeats itself :
- This theory states that the history of the stock market repeats itself. Meaning investors and market players react in the same way as they reacted in the past due to the same situation, news or company announcements.
- Therefore, technical analysts use their knowledge of how traders have reacted in the past and what has affected the stock.
Focus on a short term :
- Technical analysis of stocks focuses on shorter time periods such as a maximum of one month and a minimum of 1 minute. While fundamental analysis aims at long term investments, technical analysis focuses on the short term.
- This method of analysis suits you best if you are looking to make money in the short term or do repeat buying and selling.
Charts and graphs to be used for stock price trends:
Technical analysis of stocks uses charts and graphs to read spot price trends. A chart tells you a lot about the trend of the price movement. Where the current price of the stock is heading can be easily estimated through charts. Trends can be classified on the basis of duration and type.
Up Trends :
- An upward movement is known as an uptrend. Every day the stock price moves to a new high and then falls back down like before. You should know that this high price is not the lifetime high price but it could be the high of the last day, week or month.
- This stable high and low price shows that the market is positive about the stock.
- This is an indication that one can buy this stock as it is in an uptrend. Therefore, whenever the stock falls, the investor should consider it as an opportunity to buy. They don’t wait for the price to drop.
Downtrends :
- Downtrend refers to a pattern, where the stock price falls continuously. You may notice that not only do the Peaks become lower, but the Troughs also become lower. This makes market players convinced that the share price will fall further. Hence, investors can wait for a slight rise in the price to sell their existing positions.
- At this point of decline, investors do not prefer to buy further due to its downward trend. If you are a short term investor then it will be a disadvantageous position for you to buy but if you are a long term investor then you can wait for a little more price fall.
Horizontal / Sideways Trends
(Horizontal Trend) is a trend that does not have a fixed trend. Only Peaks and Troughs are stable. But, you cannot decide where to buy or sell the stock.
Understanding Support & Resistance Concept
Support and resistance are two concepts of a stock’s price movement in technical analysis. The stock price stops at a certain predetermined price level and reverses. Support is a price level where the price movement stops the downtrend. At this point the price of the stock avoids falling and the stock is expected to rise, it forms a support line.
Resistance refers to the highest price of a stock where traders start selling again and the stock price starts falling again. Once the areas of support and resistance are identified, trading becomes easier for you. As soon as the price reaches either of these points, there are two possibilities.
Firstly, it can break that level and move up or down and reverse on touching the support or resistance level.
Pay attention to trading volume
To be sure about the trend of the stock price, the volume of trades has to be looked at. You can get more information about the stock in the market through trading volume. If volume increases with a rise in the stock’s price, the trend is probably valid. And, if the trading volume increases only slightly, it is probably due to the opposite trend.
Use of moving average technique to remove short price action
Moving averages are a technique for visualizing a trend set. It is useful for identifying long term investments. This method removes unnecessary fluctuations by clearly revealing the overall trend. There are several methods for moving averages. Such as Simple Moving Average, Weighted Moving Average and Exponential Moving Average.
Use of Oscillators and Indicators
Indicators are calculations of technical analysis that support the trend of price movement information. It helps you to identify your decision of buying and selling. The leading indicator is useful during a horizontal trend when the movement of the stock is not constant.
Charts used in technical analysis
There are four types of charts that can be used by technical analysts:
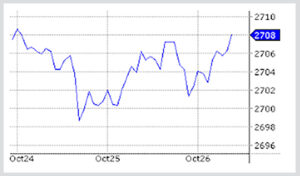
1. Line Chart :
It is made by taking the closing prices of any stock or index. They can be prepared by examining the closing prices on a monthly, weekly and even hourly basis.
2. Bar Chart :
Bar charts show all the four major prices of the day, namely, the Open, Low, High and Closing prices. The picture below shows how a bar chart can be constructed and how it shows positive or negative sentiment over a time period.
3. Candlestick Chart :
These are the most important and are used by most traders. It shows the open, low, high and closing price of the stock.
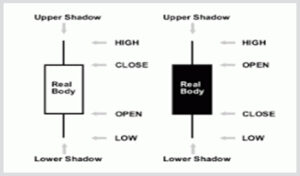
A candlestick has three parts:
- The real body : It is made by combining the open and closing prices. The body of the bullish and bearish candlesticks are depicted by different colors.
For example: In the above picture, we are using white color for bullish candlestick and when the open price is lower than the closing price and black color is used to show bearish candlestick where the close price is higher than the open. is less than the price.
- Upper Shadow : It connects the high price to the close price in case of a bullish candlestick. Similarly, in the case of a bearish candlestick, it connects the high to the open price.
- Lower shadow : This adds to the low price opening in the case of a bullish candlestick. Similarly, in the case of a bearish candlestick, it connects the low to the close.
Candlesticks are easy to interpret and can be created for different time frames such as monthly, weekly, daily or intraday charts. They form certain patterns which help in predicting the future price of a stock or index. There are many types of candlestick patterns which we will discuss in another post as a separate topic.
4. Point and Figure Chart :
They reflect price movements without considering the passage of time. They include X and O which represent price movement in different directions. X represents an increase in prices. O represents a fall in prices. An X on the graph means a price unit increase and an O means a price unit decrease.
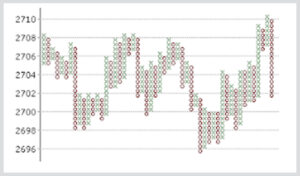
If the stock price unit has increased four times, the column of 4X is plotted. Therefore, X and O can never appear in the same column. Please see the picture below for more clarity.
Summary: How to do Technical Analysis
Before concluding this topic of technical analysis, let’s quickly review the various theories surrounding this concept.
- Know about the trade volume in the market.
- Get an idea of support and resistance.
- Get an overall idea of the trend by using the moving average method.
- Get a clear understanding of all three of Dow’s investment principles.
- Try looking for results for a shorter period.
- Try to understand the trends of the stock.
- Use the indicators and oscillators that support the price movement to help you make your buying and selling decisions.